
Opia documentation
Understand current operational health
Use the Dashboard to understand current Opia and managed-network health.
Applies to Opia 26.8.1The Dashboard is the quickest place to see whether Opia, its Agent and the managed environment need attention. Use it as a starting point, then open the underlying view for detail.
What the Dashboard shows
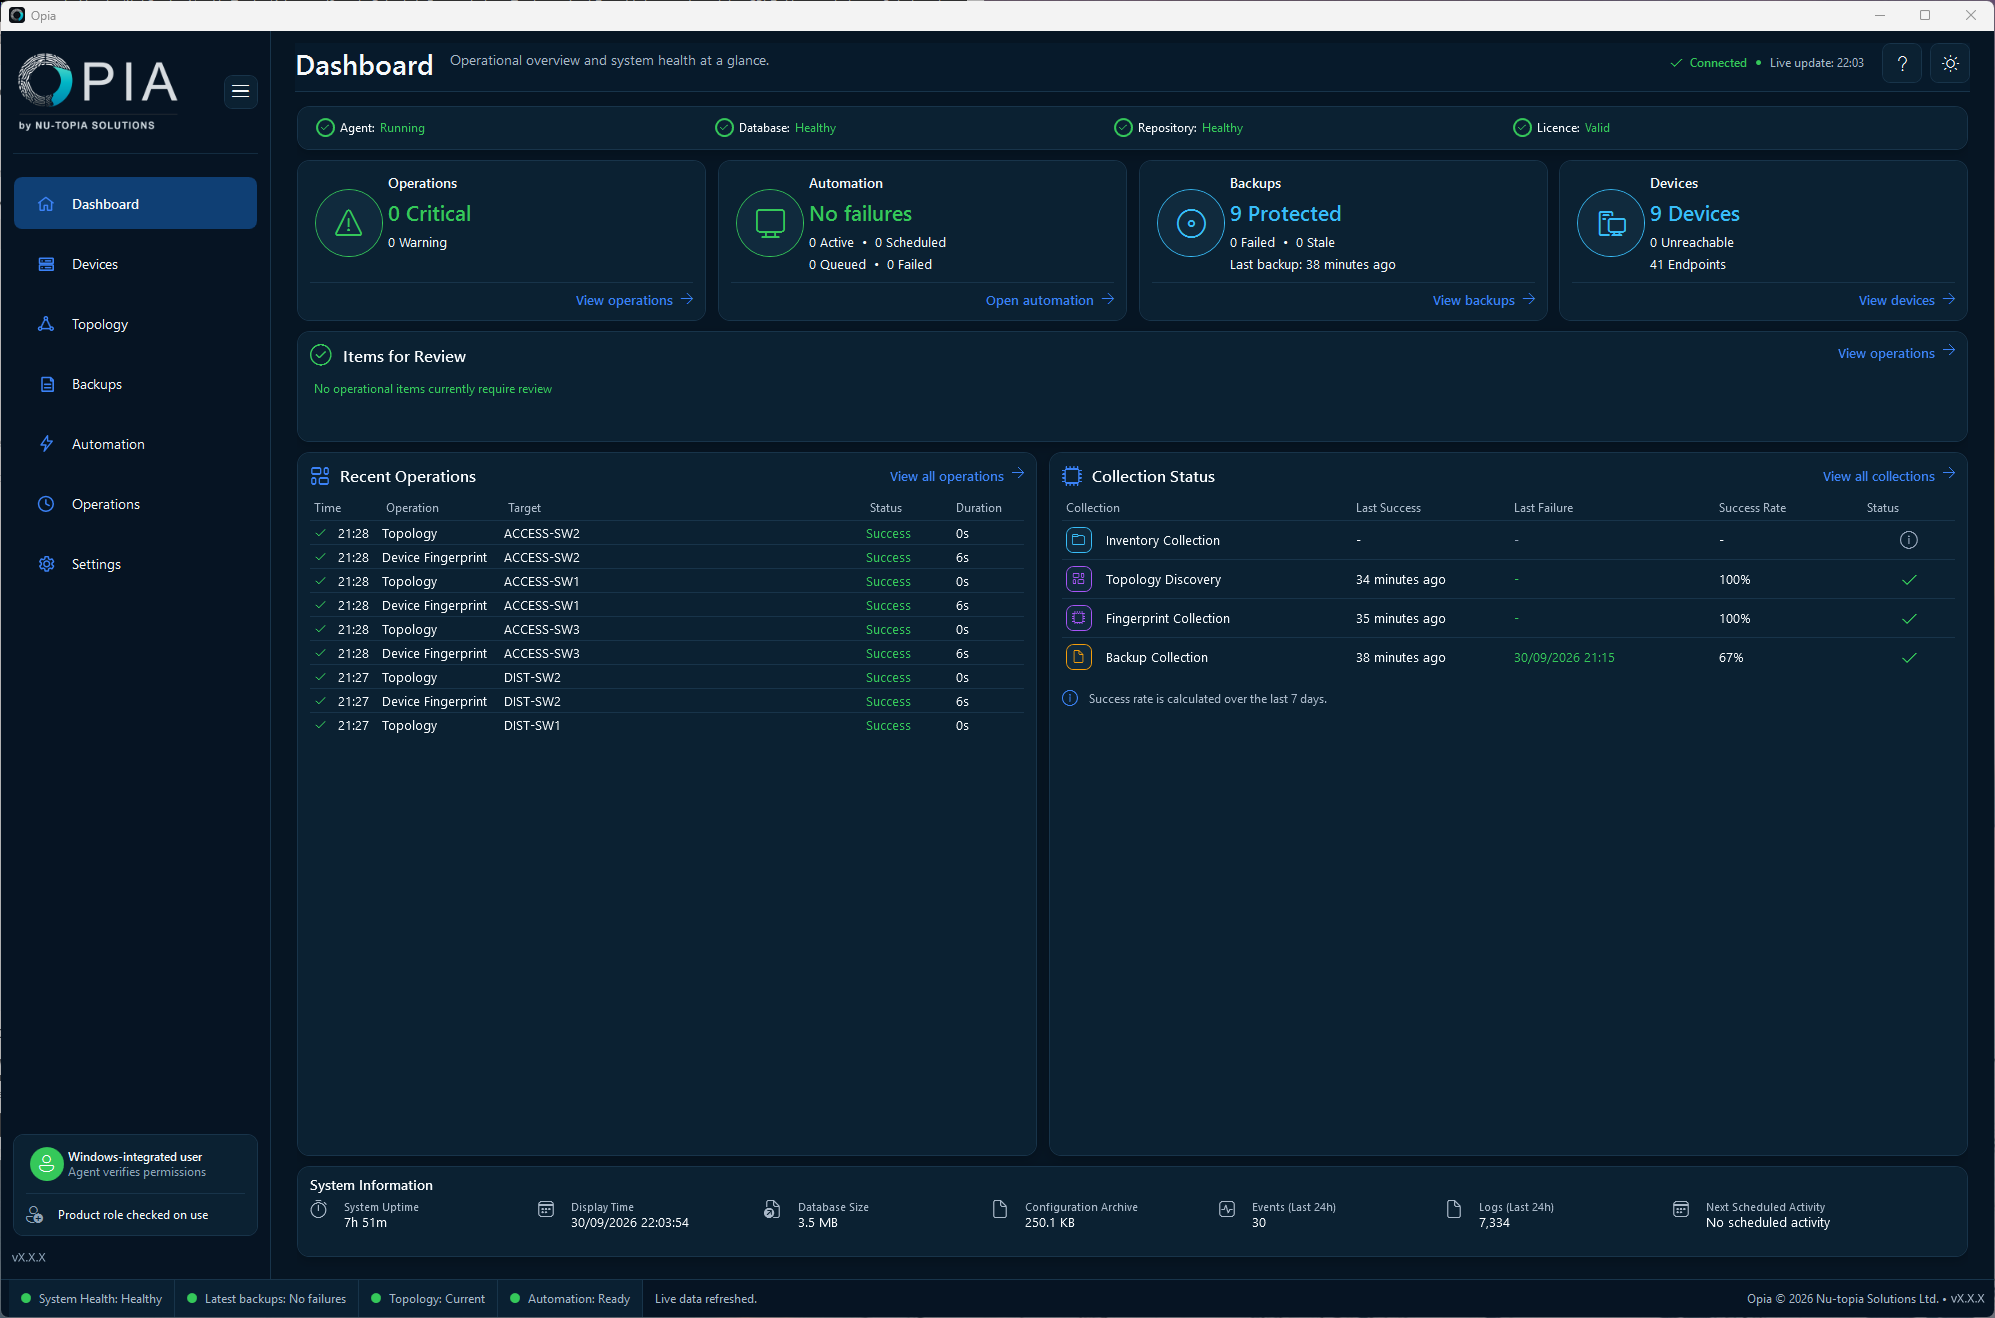
- Managed devices and their current operational state.
- Backup coverage, recent results and configuration-change evidence.
- Fingerprint and inventory freshness.
- Topology evidence and recent changes.
- Critical and warning issues plus recent operations.
- Current licence status and Managed Network Unit capacity.
- Opia Agent status and heartbeat.
Select a card or recent item to open the detailed view; the Dashboard is a summary rather than the complete record.
Agent status
| State | What it means | What to do |
|---|---|---|
| Running / current | The Agent heartbeat is current. | Continue and use Operations for individual jobs. |
| Missing | No usable Agent runtime state has been observed. | Check the OpiaBackgroundAgent Windows service. |
| Stale | A previous heartbeat exists but is no longer current. | Check service status, logs and database access. |
| Degraded / Faulted | The Agent has reported a configuration or runtime problem. | Open the related issue and collect support evidence if required. |
| Agent state differs | The application and fresh Agent state disagree on licensing or runtime identity. | Confirm the application and Agent versions, current licence state and shared data configuration. |
When data looks stale
The application can still display previously stored devices and history while the Agent is stopped. Likewise, a Windows service can be running while the application cannot see a current heartbeat. Always use the timestamp and status shown on the Dashboard rather than assuming that a Running service means all Opia functions are healthy.
First checks when something is wrong
- Select the affected Dashboard card to open the detailed view.
- Refresh Opia and confirm the Windows system time is correct.
- Check that
OpiaBackgroundAgentis Running. - Review Operations → Activity Runs for execution and results, and Operations → Action Queue for related issues in the same time period.
- If the cause remains unclear, generate a support bundle from Settings → Diagnostics.